l-threonine
other nitrogen compoundFound in 581 ingredients across the CompKitchen flavor graph.
Look up another compound — search by name, CAS number, PubChem CID, or FEMA #.
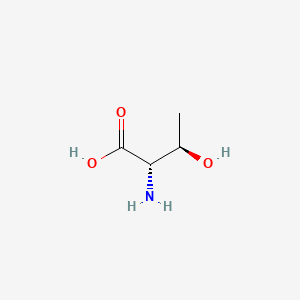
- Formula
- C4H9NO3
- Molecular weight
- 119.12 g/mol
- PubChem CID
- 6288 — full record on PubChem
Properties
- Odor threshold — in a food matrix
- 0.020 ppb – 0.190 ppb median 0.105 ppb · 2 published values · see all 2 with sources
- Volatility
- low
- CAS number
- 72-19-5
- Retention index
- 1420
FEMA GRAS — Generally Recognized As Safe for flavoring use
- FEMA number
- 4710
- GRAS publication
- GRAS 25
- FEMA primary name
- L-THREONINE
Reported use levels (ppm by food category)
Typical vs maximum reported addition levels in finished food. Use as a regulatory ceiling reference — verify against the current GRAS publication for your product category.
| Food category | Typical (ppm) | Maximum (ppm) |
|---|---|---|
| baked goods | 50 | 200 |
| beverages (alcoholic) | 50 | 200 |
| beverages (non-alcoholic) | 50 | 200 |
| breakfast cereal | 50 | 200 |
| cheese | 50 | 200 |
| chewing gum | 50 | 200 |
| condiments/ relishes | 50 | 200 |
| confectionery frostings | 50 | 200 |
| egg products | 50 | 200 |
| fats/oils | 50 | 200 |
| fish products | 50 | 200 |
| frozen dairy | 50 | 200 |
| fruit ices | 50 | 200 |
| gelatins/puddings | 50 | 200 |
| granulated sugar | 50 | 200 |
| gravies | 50 | 200 |
| hard candy | 50 | 200 |
| imitation dairy | 50 | 200 |
| instant coffee/tea | 50 | 200 |
| jams/jellies | 50 | 200 |
| meat products | 50 | 200 |
| milk products | 50 | 200 |
| nut products | 50 | 200 |
| other grains | 50 | 200 |
| poultry | 50 | 200 |
| processed fruits | 50 | 200 |
| processed vegetables | 50 | 200 |
| reconstituted vegetables | 50 | 200 |
| seasonings/ flavors | 50000 | 100000 |
| snack foods | 50 | 200 |
| soft candy | 50 | 200 |
| soups | 50 | 200 |
| sugar substitutes | 50 | 200 |
| sweet sauces | 50 | 200 |
Published thresholds
2 measured values from the literature. Grouped by what was actually measured — a threshold smelled in clean water, tasted in the mouth, or measured in a real food are three different quantities and are not pooled.
In a food matrix
0.020 ppb – 0.190 ppbMeasured in a real food, where the matrix shifts detection — not a clean-water value.
| Threshold | Matrix | Source | Paper |
|---|---|---|---|
| 0.020 ppb | water (food: onion) | Literature corpus | — |
| 0.190 ppb | water (food: unknown) | Literature corpus | — |
Only values we can attribute are listed. Where a compendium's licence does not permit public attribution its figures are omitted here, so every number on this page traces to a citable source.
Found in
Measured impact first, then profile shareEvery ingredient known to contain l-threonine. Ingredients with a measured concentration come first, ranked by odour activity; the rest follow by how large a share of that ingredient's profile this molecule is. The figure beside each is how many different compounds that ingredient has in total — not the concentration of l-threonine in it.
The inverted compound index is a Pro feature — reverse-search any of 5,240 flavor molecules across the full graph.
Get a molecule-level pairing breakdown each week — which ingredients share a compound, and why it matters at the table. Free, no spam.
Prefer an account? Create a free account to save pairings and unlock the full chemistry.
Try the pairing tools to see which ingredient combinations rely on l-threonine, or compare two ingredients side-by-side.