
plant green & herbal fruity Vegan Gluten-free Dairy-free Nut-free Kosher Halal

Tea

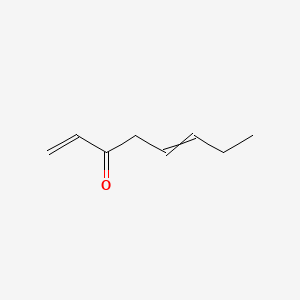
Tea is a plant with 615 known flavor compounds. The most distinctive molecule is flowery-citrus-like. It pairs most strongly with coffee, sharing 267 flavor compounds. Tea appears in 2,480 recipes, most commonly in world cuisine.

Green grassy vegetal character with floral and citrus from terpenes. Herbal complexity varies by oxidation and variety.

Scientific name: Camellia sinensis
species of plant
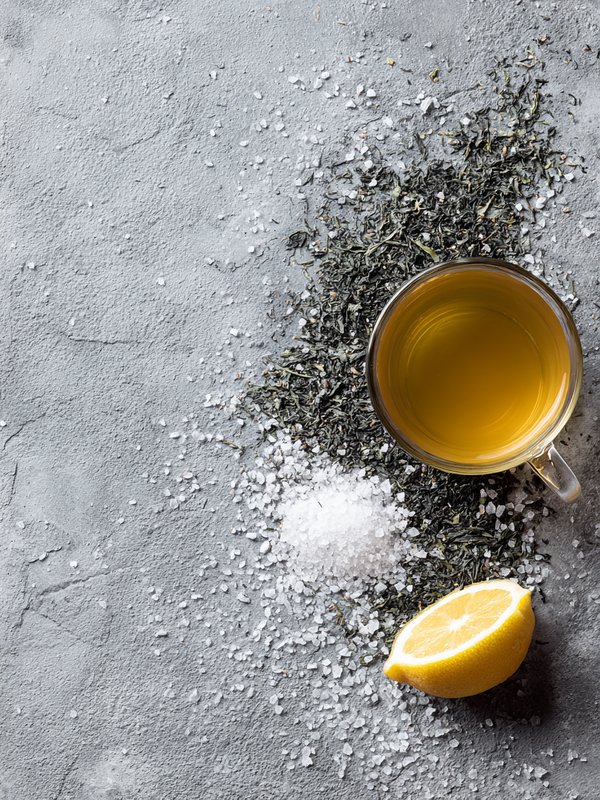
Tea — ingredient reference image
615
Flavor Compounds
8
Top Pairings of 856 scored

Flavor Science

Flavor Profile Breakdown

615 compounds

How Tea's 615 known compounds break down by aroma category. Percentages are of compounds with a known label.

fruity 84 · 13.7%
floral 71 · 11.5%
green 54 · 8.8%
roasted 54 · 8.8%
herbal 50 · 8.1%
sour 50 · 8.1%
other 42 · 6.8%
spicy 27 · 4.4%
woody 19 · 3.1%
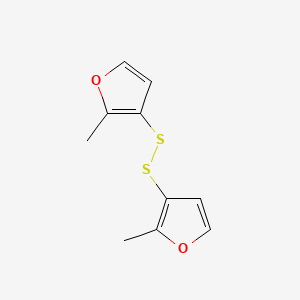
sulfurous 13 · 2.1%

Most Used In

Flavor Compounds

347 of 615 are distinctive to tea — they appear in under 10% of foods. The remainder are the background most foods share.

Ordered by measured impact in tea — concentration against odour threshold where both are published, then by how distinctive the molecule is across the graph. Molecules measured here but not established as odorants sit below those that are.

Molecules volatile enough to reach the nose.

Most Abundant Molecules

109 of 615 quantified

Ranked by median concentration across published studies. Only 109 of Tea's 615 compounds have a measured concentration in the literature — the rest are confirmed present but not yet quantified. Bars are log-scaled.

1 benzyl benzoate 1.7 mg/kg
2 spathulenol 1.6 mg/kg
3 geranyl acetate 1.4 mg/kg
4 neryl acetate 1.4 mg/kg
5 undecanal 1.4 mg/kg
6 carvacrol 1.3 mg/kg
7 myrtenol 1.2 mg/kg
8 acetophenone 1.1 mg/kg
9 thymol 1.1 mg/kg
10 camphene 951 µg/kg
11 perillaldehyde 908 µg/kg
12 ethyl lactate 861 µg/kg
13 acetoin 778 µg/kg
14 pentanal 735 µg/kg
15 eugenol 653 µg/kg

Best Pairings for Tea

Ranked by how often cooks actually use them together, across 453,403 recipes — the familiar answer first. Each pairing still carries its molecular score and shared-compound count; only the ORDER differs. Counts cover every characterised molecule the two ingredients have in common, not only the aroma-active ones, so they can exceed an ingredient’s aroma-compound count. For the chemistry-first view — where the surprising pairings live — see the molecular network below, the side-by-side comparison, or the Pairing Tool.

Molecular Neighborhood

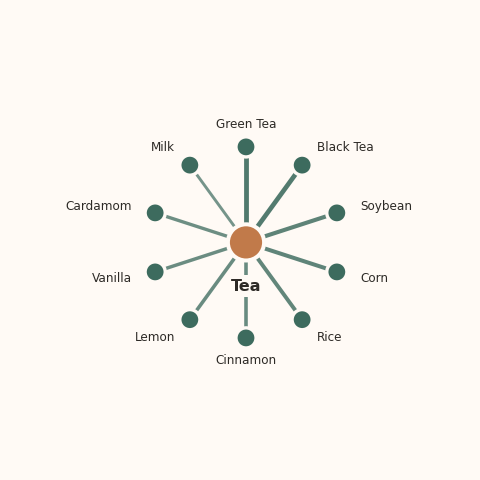
Tea and its 10 closest compound-sharing relatives. Spoke thickness = shared compounds; circle size = that ingredient's own compound count. Drag to rearrange, scroll to zoom, click to open.

Molecular neighborhood diagram of tea — top 10 ingredients ranked by shared volatile compounds

Recipes with Tea

View all →
Research basis

Tea is supported by 2,138 peer-reviewed papers

Drawn from PubMed + Europe PMC + food-science journals. Click any title to read the full abstract on the original source.